Manhattan, New York Property Historical Price Trends
Posted by Wei Min Tan on October 22, 2025
Manhattan Condominiums and Cooperatives
The Manhattan residential property inventory consists of 70 percent rental buildings, 20 percent Cooperative apartments and 10 percent Condominium apartments. Cooperatives and Condominiums are apartments that can be purchased individually. In contrast, a rental building is where one needs to buy the entire building and cannot buy an individual apartment.
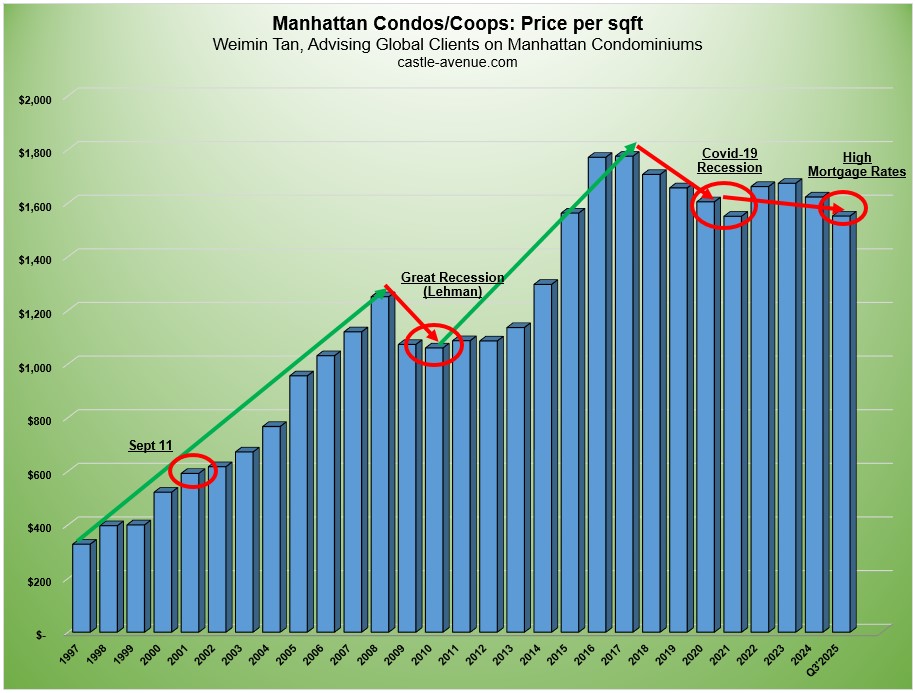
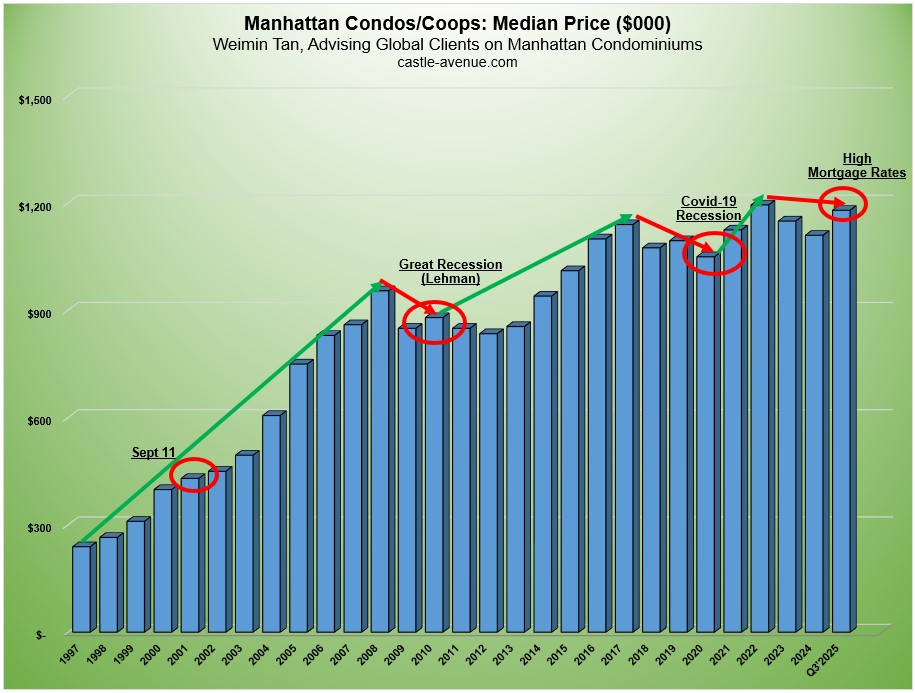
Below are graphs for Condominiums and Cooperatives blended mix for price per square foot, median price and sales volume. The red circles represent significant events.
Average price per square foot
Graph above shows historical appreciation trend of Manhattan condominiums and cooperatives in terms of average price per square foot. In 1997, the average price per square foot was $328. 2017 set the new price record at $1,775 per sqft, then decreased to $1,657 in 2019. The downturn between 2017 to 2019 was firstly due to the natural real estate cycle and specifically because of an oversupply of high end apartments, a new federal tax bill that decreased interest deductibility and global trade wars.
In 2020, Manhattan was hit hard by COVID-19. The COVID market bottom was around May to July 2020. In addition, deals that closed in Q1’2021 reflected deals that were struck in late 2020 and that explains the further dip. The post-COVID recovery also began in Q1’2021 and consequently, sales volume in 2021 surged to the highest level in 32 years. This was driven by low mortgage rates, pent up demand and overall optimism from high vaccination rates and reopening of the economy. Prices continued increasing through Q2’2022 although still not to the peak of 2017.
Downturn from rate hikes
Because of the very strong post Covid job market and consumer spending, the U.S. started experiencing record high inflation in the second half of 2022. In response, the Federal Reserve implemented aggressive interest rate hikes in attempts to combat inflation and slow down the economy. In June 2022, inflation reached 9.1 percent but subsequently declined to 6.5 percent in December 2022. The interest rate hikes seem to be working because the latest August 2025 inflation rate was 2.90 percent.
The Fed’s interest rate hikes resulted in mortgage rates more than doubling compared to a year ago. Mortgage rates that used to be 3 percent doubled to 7 percent. Manhattan property sale volume dropped dramatically because it suddenly became a lot more expensive for buyers needing mortgage financing. Sale volume was almost non-existent in the second half of 2022, and opportunistic cash buyers took advantage of this slowdown.
Price goes up over long term
Looking at historical trends, prices increase steadily for several years, go down during a recession and back up for several years each time. Note that the average price per square foot of a Manhattan condominium in Q3’2025 was $1,998, representing a significant premium over the condo/coop average of $1,552 shown in the graph.
Read the latest Manhattan property market report
Read about Wei Min’s style in Best Manhattan property agents and Role of a buyer’s broker.
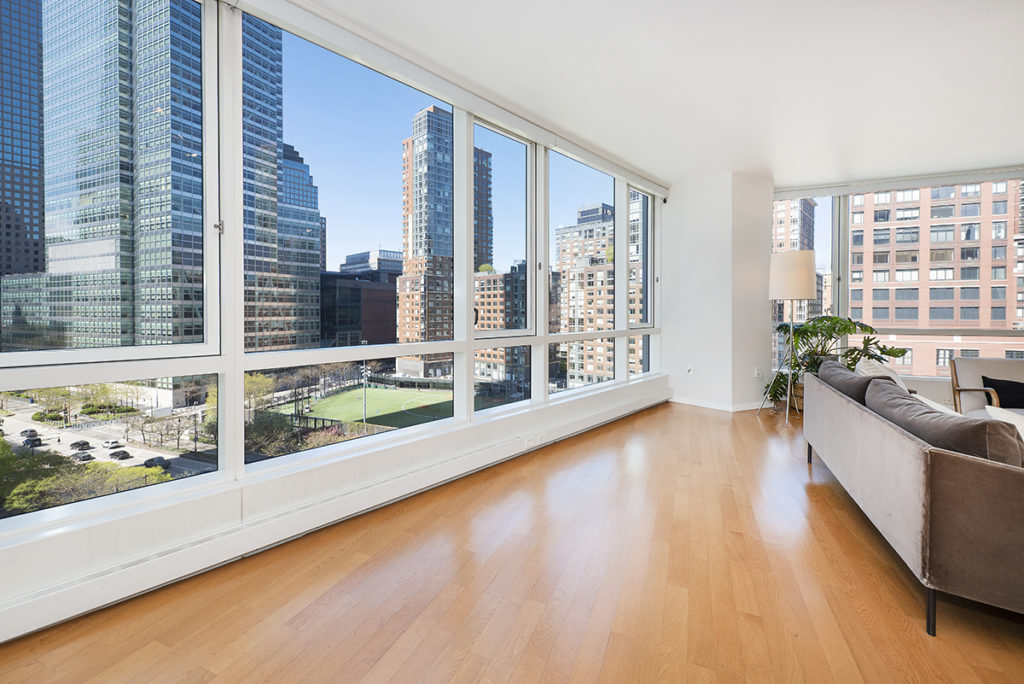
Deal Example: Investor client’s 3-bedroom condo in luxury Tribeca building. Great open view overlooking the Battery Park Ballfield. We targeted 3 bedroom condos because of the market’s need for more space post pandemic. Rented out in 1 week.
Weimin’s article, Buying Manhattan apartment to rent out as diversification strategy
Median price
Graph above shows the historical median price of a Manhattan condo/coop increasing from $239,000 in 1997 to $1.18 million in Q3’2025. While the graph shows the blended average of condo/coop, the median price of a Manhattan condo in Q3’2025 was $1.650 million.
Deal Example: Investor client’s prewar West Village condo with high ceilings, amazing open views and prewar charm. These wow factors are highly appealing to potential tenants.
Weimin’s article, Investing in West Village.

Transaction volume
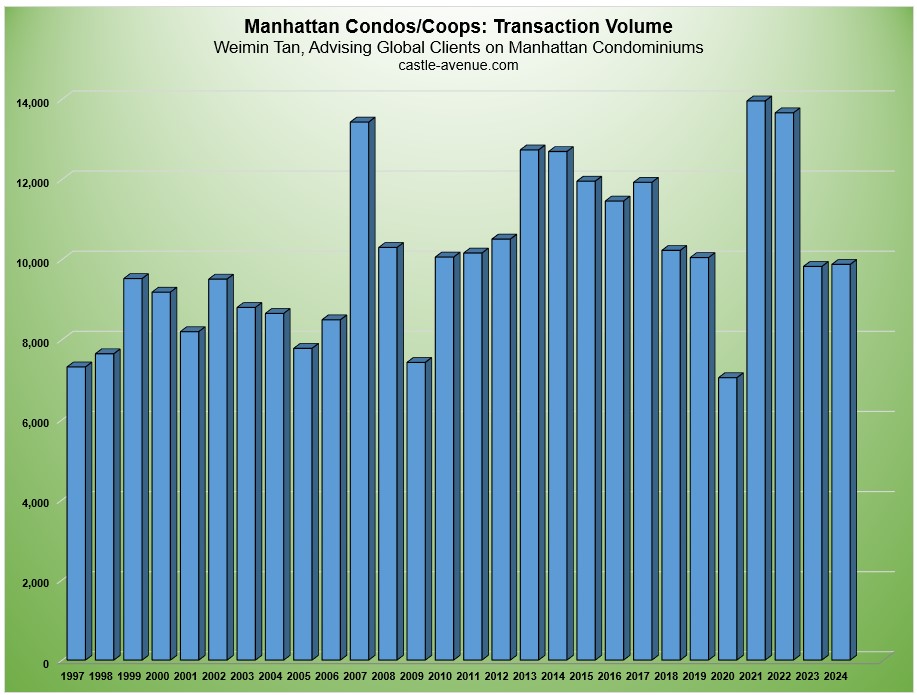
Transaction volume dropped significantly in 2023 and 2024 because of elevated mortgage rates.
Looking at the graph above, post Covid 2021 was the record year in sales volume. Surprisingly, 2022 was the second highest, driven by transactions in the first half of 2022, which still enjoyed record low mortgage rates. Sale volume was down significantly during the second half of 2022. 2020 had the lowest transaction volume at 7,048 transactions. This was Covid year and we had 3 months of market lockdown.
Learn more New property projects in Manhattan, how we pick winners
Deal Example: Client’s condo at 111 Murray Street in Tribeca. Reserved the unit at pre-construction, waited two years for completion after which market price increased 20 percent. The green building opposite is the Goldman Sachs headquarters and one of the reasons we decided to pursue this unit.
Weimin’s article, How to invest in new launch property in Manhattan

What We Do
We focus on global investors buying property in Manhattan, New York for portfolio diversification and long term return-on-investment.
1) Identify the right buy based on objectives
2) Manage the buy process
3) Rent out the property
4) Manage tenants
5) Market the property at the eventual sale

Data sources: Miller Samuel Appraisers
Follow On Instagram
Wei Min Tan is a Manhattan, New York property broker focusing on global investors. He has been interviewed by CNBC, CNN, New York Times and The Wall Street Journal on the subject of investing in Manhattan property. Wei Min can be reached at tan@castle-avenue.com
Related Links:
Foreign Buyer Guide To New York Property

