

Manhattan Condo Historical Price Trend
Posted by Wei Min Tan on May 19, 2026


Manhattan Condo Historical Price Trend
Manhattan property (condominium) investment performance. Apartments that can be purchased individually in Manhattan are either Cooperatives or Condominiums. Condominiums are more investor friendly because they do not require board approval and allow owners to rent out as needed. As such, the price per square foot of a Condominium is about 50 percent higher than that of a Cooperative.
The below are graphs for Manhattan residential condominiums for price per square foot, median price and sales volume. The red circles show significant periods and how Manhattan condos weathered those challenging times. We are in the midst of a market with low supply and sales volume because of high mortgage rates.
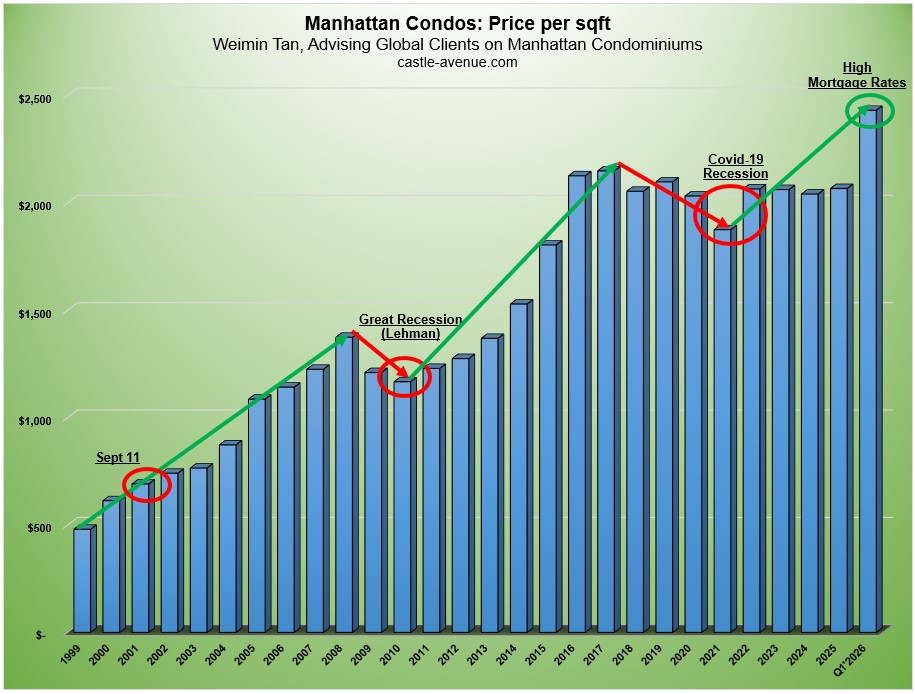
Manhattan condo average price per square foot
Graph above shows historical appreciation trend of Manhattan residential condominiums in terms of average price per square foot. In 1999, the average price per square foot was $480. Prices increased through 2008, then declined in 2009 and 2010 because of the U.S. recession. From 2008 to 2010, the decline was about 15 percent, when rest of the country was down by 35 percent.
After the recovery, price continued increasing until 2017. Then in 2018, we experienced a correction due to changes in tax law, global trade wars and increasing interest rates. 2017 – 2019 was a downturn period for Manhattan property. In Q2’2020, the Manhattan market was hit hard by COVID-19. 2020 and first half of 2021 reflected the COVID deals. The price per sqft in Q1’2021 was $1,714 and represented the quarterly lowest from the pandemic.
The post-COVID recovery also started in Q1’2021. By Q4’2021, price per sqft recovered 16 percent from Q1’2021 to $1,989. From Covid, prices increased till Q2’2022 to $2,132 per sqft. Pent up demand, low interest rates, optimism from the reopening of New York all drove the 2021 Manhattan market to the highest level of activity since 1989. Supply of inventory dropped from 13.5 months of supply in Q4’2020 to 6.9 months in Q2’2022.
Fed and interest rates
Sales activity slowed significantly in the second half of 2022. Because of 40-year high inflation, the Fed increased interest rates and consequently, mortgage rates more than doubled from a year ago. The 30-year mortgage went up to 7 percent (vs 3 percent a year ago).
High inflation and mortgage rates converted a lot of buyers into renters and decreased sale transaction volume in Q3’2022 by 24 percent. The final 2022 average price per sqft was $2,065, still up 10 percent compared to 2021. This was driven by a strong market in the first half of 2022 but a big drop in activity in the second half of the year.
In 2024, inflation came down and the Fed started decreasing interest rates. The latest data, Q1’2026, shows price per sqft at $2,431 which is a new record.
Read the latest Manhattan property market report

Read about Wei Min’s style in Best Manhattan property agents and Role of a buyer’s broker.
Weimin’s article, Risks with buying into new property projects in Manhattan
Deal Example: 305 E 51 St, Halcyon. Buyer client reserved property at pre-construction stage. Completed 2 years later and rented out with strong cashflow to owner since then. Property is close to the United Nations, Citigroup Center, Blackstone, Blackrock, Chase Bank.

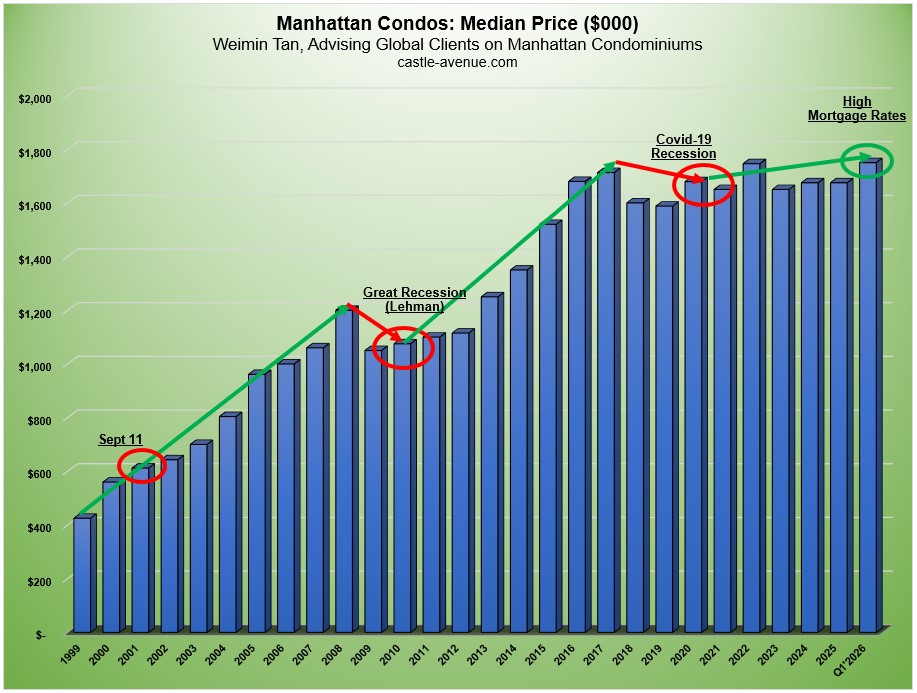
Manhattan condo median price
Graph above shows the historical median price of a Manhattan residential condo increasing from $425,000 in 1999 to $1.7 million in 2017. During the downturn period of 2017-2019, median price declined to $1.588 million. Median price in 2022 was $1.746 million, a new record surpassing even the 2017 level. In Q1’2026, median price was at $1.75 million.
Weimin’s article, How to buy new property in Manhattan
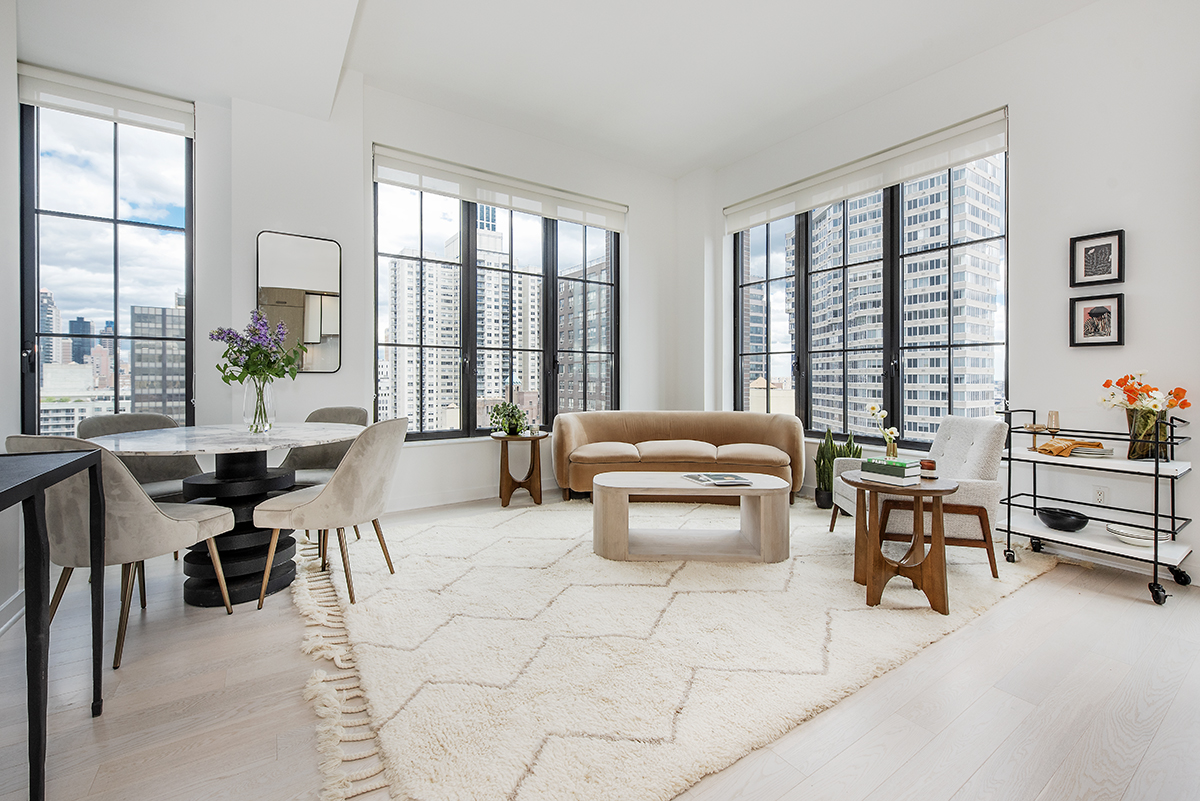
Deal Example: Represented buyer client in the below purchase, at one of Manhattan’s most distinguished prewar buildings built by Bing & Bing. High ceilings, sunken living room, amazing southern views. We got 10 viewers the first day and rented out the same day.

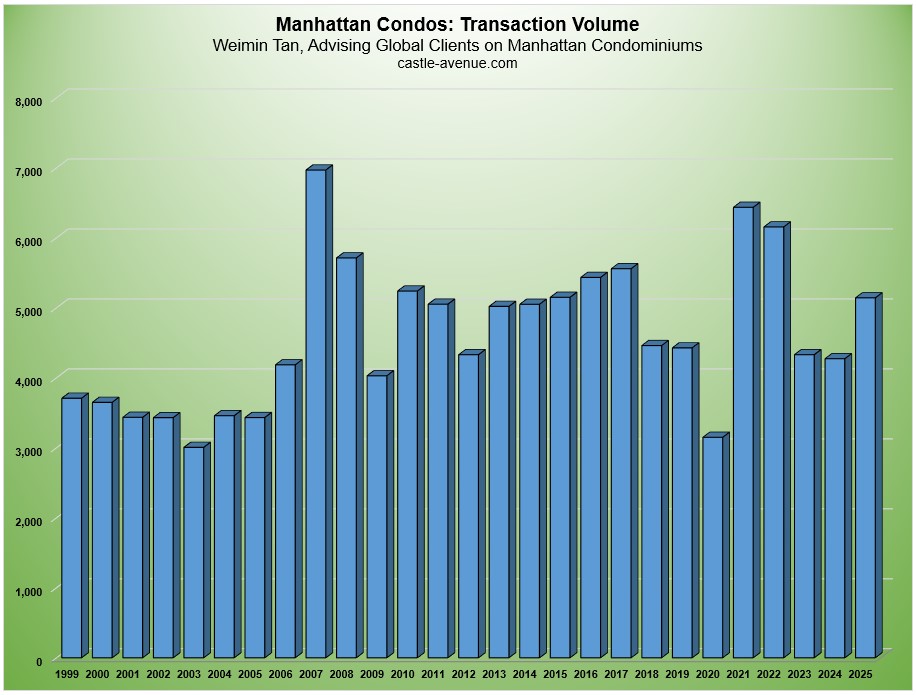
Manhattan condo number of transactions
Graph above shows the trend for number of transactions per year, from 1999 to 2023. The peak was 7,000 transactions in 2007. 2020 was Covid year and the real estate market closed down for 3 months hence the deal volume represented only 9 months of activity.
For condos, 2021 sales volume was almost as high as 2007 driven by pent up demand, low mortgage rates and optimism returning to the market from reopening of the economy. When looking at the overall condo and coop market, 2021 transaction volume surpassed 2007 and was the highest ever recorded.
In 2022, the first half had high sales volume because of still low mortgage rates. In the second half, sales volume slowed because of inflation which led to interest rate hikes. Surprisingly, 2022 volume is still one of the highest recorded, driven by the first half. We are now in a buyers’ market. High mortgage rates led to a pullback in transaction volume and buyers becoming renters. Meanwhile, rental prices were at historical highs with double digit rental price increases.
In 2023 and 2024, number of sales were lower than 2022. This is because of high mortgage rates and limited supply as sellers held off on selling because they would face much higher mortgage rates if they sell and consequently buy their new property.
In 2025, transaction volume increased again, driven by lowered mortgage rates, shrinking inventory and people coming back into the market after sitting on the sidelines.
Weimin’s article, Interview with Aidan Booth, online entrepreneur and property investor
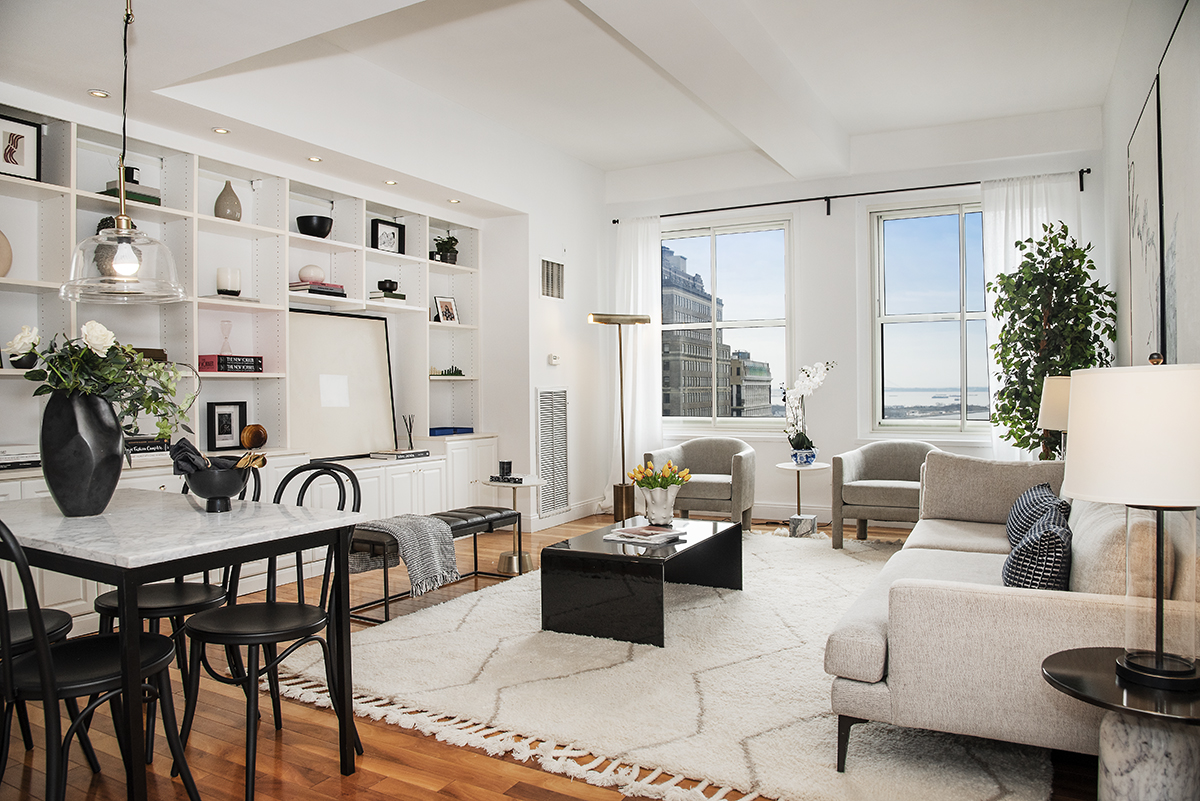
Deal Example: Client’s 3 bedroom investment condo at 200 Chambers. Amazing open views because it looks out to a ballfield. Most Manhattan apartments look out to a neighboring building. Close to World Trade Center and Goldman Sachs HQ. Rented to a highly qualified tenant immediately.

What We Do
We focus on global investors buying property in Manhattan, New York for portfolio diversification and long term return-on-investment.
1) Identify the right buy based on objectives
2) Manage the buy process
3) Rent out the property
4) Manage tenants
5) Market the property at the eventual sale
Data sources: Miller Samuel Appraisers
Follow On Instagram

Related Links:
Property investment in New York